Quality Assurance (QA) Procedures and Results – Siemens PRISMA MRI Scanner
The Purdue Life Science MRI Facility performs regular QA measures on its Siemens PRISMA scanner to provide high reproducibility of results for its users and to identify any technical issues or irregularities early on. Periodically performed QA exams include a weekly measure of center frequency (according to ACR standards), as well as a weekly fMRI and MRS QA procedure, measuring center frequency, signal-to-fluctuation noise ratio (SFNR) for fMRI, and line width in MRS, over time. In addition, results of one-time QA measures are being reported here, e.g. on frequency drift after a long EPI scan, or reproducibility of GABA MRS measures.
Center Frequency (CF) over Time
Monthly acquired CF values are plotted in Figure 1. Allowed limits (red lines) are defined as ± 2 ppm (or ±246 Hz). “Typically for superconducting magnets the change from week to week should be less than a few parts per million (ppm).” (ACR Manual 2015) The dashed line represents an overall trendline through the data, indicating the general frequency drift.
Results:
- The mean center frequency of the PRISMA scanner is 123.252431 MHz.
- The Standard Deviation over this time period is 1.1462e-05 MHz = 11.46 Hz = 0.09 ppm
- The Coefficient of Variance of this time period is 9.3e-07 MHz = 0.93 Hz < 0.01 ppm
- Over the past 3 months the center frequency has drifted by 50 Hz = 0.41 ppm
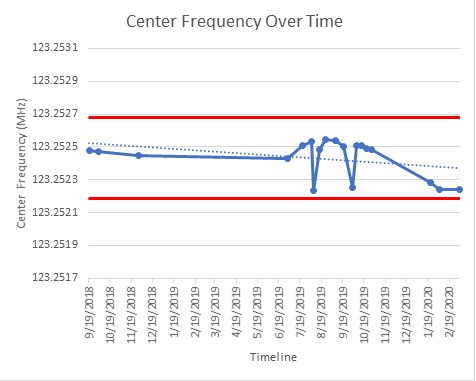
Figure 1. Center Frequency (CF) changes over time, measured by sagittal localizer sequence with weekly ACR QA protocol (Nathan Ooms)
fMRI QA
Since stability of the MR scanner is important for fMRI studies, we have implemented a specific fMRI QA protocol, measuring the Signal-to-Fluctuation Noise Ratio (SFNR). The SFNR reflects system stability such as stability of the RF amplifier or gradient system. It is defined as the mean signal intensity divided by the standard deviation of the total noise within the evaluating ROI. The measurements are performed using the 64-channel head coil, the large Siemens Phantom, and an EPI sequence (TE = 29ms, TR = 2250ms, Acquisition Time = 7:38 min).
Figure 2 shows the SFNR stability since January 2020. This graph is being updated every month. The x-axis is the time and the y-axis shows the mean SFNR. Each blue dot represents a weekly QA run. The solid line represents the mean of the first six data points. The dashed lines represent the upper and lower thresholds, defined as mean ± 3*standard deviation (std.) of the first six data points.
Results:
- The mean SFNR of the PRISMA Scanner is 187.73.
- The coefficient of variance of the SFNR over the past 3 months is in the order of 3%, which represents a high stability well within 2*std.
- No general change over time has been observed to date
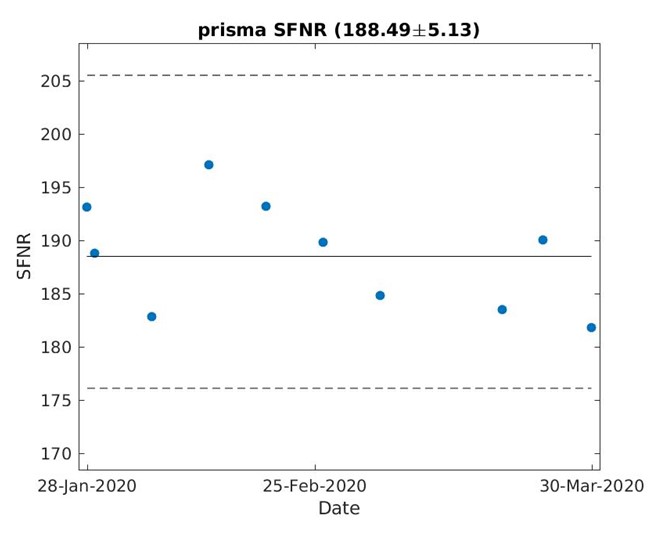 Figure 2. Longitudinal SFNR stability
MRS QA
A non-water suppressed single voxel sLASER sequence (eja_svs_slaser,TE = 35, TR = 2000, Averages =64, Acquisition Time = 2:28 min) is run each week, using a VOI of 30*30*30 mm placed in the center of the large Siemens water Phantom. The 64-channel coil is used. Measured outcomes are the shim value during preparation, the center frequency determined during preparation, and the linewidth and area of the water peak. Respective graphs over time are shown in Figures 3a–d.
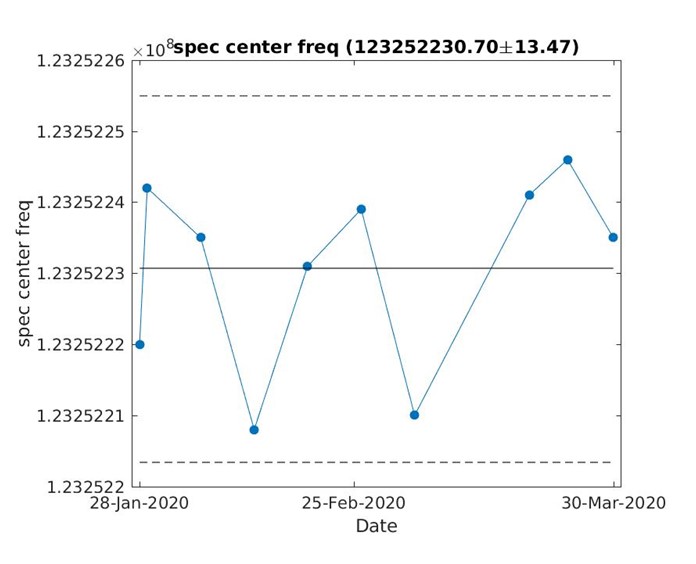 Fig. 3a: Center frequency changes for sLaser sequence
Results: The fluctuation of the CF for sLASER is within the range of 43 HZ.
- Siemens MRI
- Siemens QA
- Siemens MRI